
UAS (drone) bird’s eye photo over central part of the McCormick & Baxter beach & riparian area

Calculating and Interpreting Multispectral Imagery
Multispectral imaging creates several images for each photo based on defined wavelength bands, in this case Green, Red, and Near Infrared (NIR). This information is used to analyze and visualize the photosynthetic activity of plants and other factors that undergird plant health. .
Healthy plants absorb some red energy, and reflect green and NIR energy. Their health can be measured based on this degree of “infrared reflectance.”
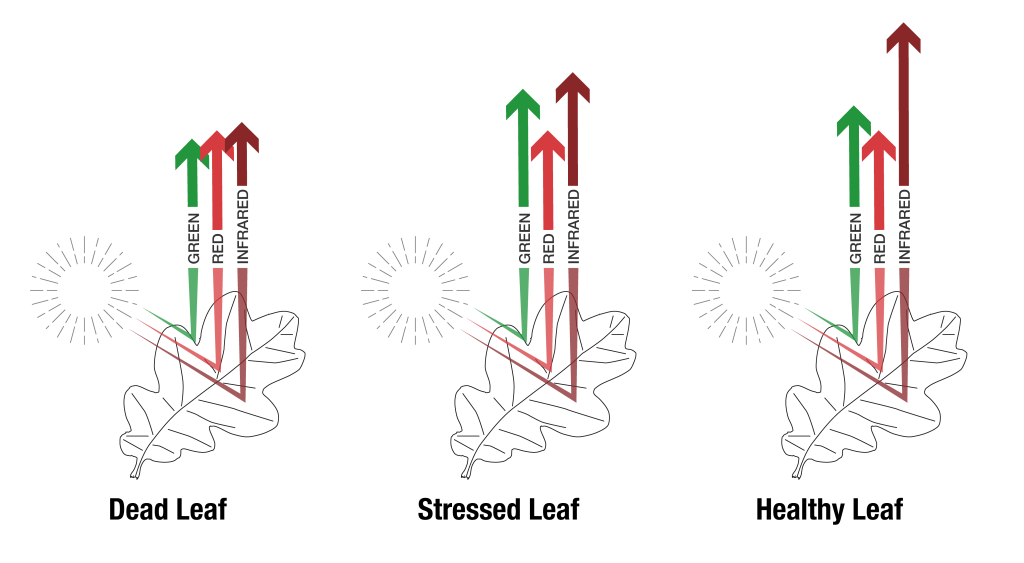
Green and NIR have higher reflectance in healthier plants
The difference in reflectance between NIR and red light is calculated using the Normalized Difference Vegetation Index (NDVI)
NDVI = (NIR – Red) / (NIR + Red)
This indicates the presence of chlorophyll because sick, dehydrated, and/or diseased plants absorb more NIR light. A color gradient is then assigned to the results to visualize the data in maps and plans.
Different equations are used to measure different factors affecting vegetation health. The technology is most commonly used in agriculture and forestry to identify areas of stress within large monocultures, but is applied by LND LAB to evaluate vegetation health in ecological restoration.
Fuller Initiative Land Lab
At the Fuller Initiative Land Lab, multispectral imaging revealed differences in subsurface conditions affecting vegetation health that were otherwise invisible to the naked eye. For example, a perfect circle was discovered near the site of a former asphalt plant, indicating a footing or other underground structure remains on site.

Yellow in the NDVI image (right) shows areas of little to no photosynthesis, while dark blue-green show the healthiest vegetation. Mow rows show lighter because of dead plant material.
Similar findings were made at McCormick & Baxter site, where the edge of the impermeable cap is clearly defined. The thin, nutrient-poor soils on the cap are visible in shades of blue, in contrast with the relatively healthy grasslands and micro forests growing on the soil cap (green to dark green).
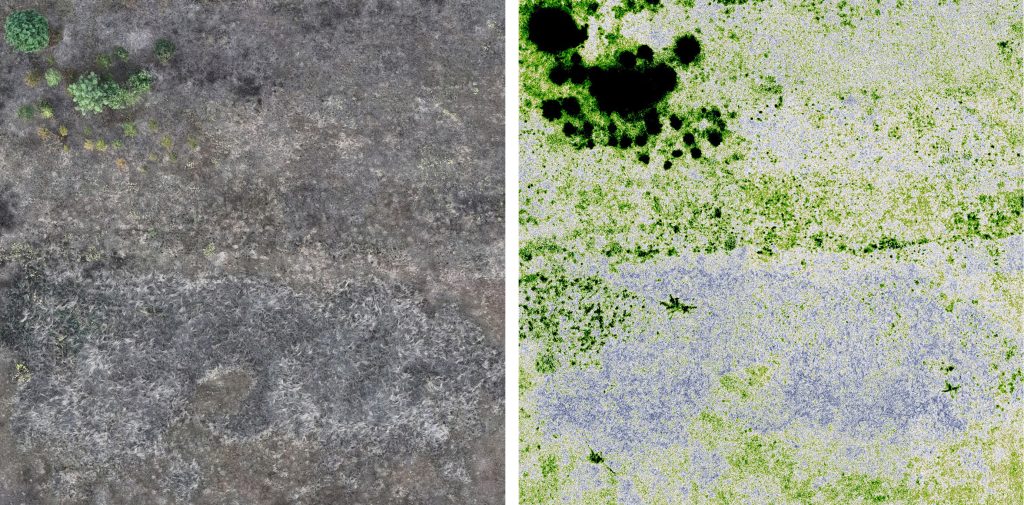
Blue in the GNDVI image (right) shows areas of little to no photosynthesis, with dark green for the healthiest vegetation. While faintly differentiated in the orthomosaic (left), the edge in this location cannot be identified at ground level.
McCormick & Baxter UAS (Drone) Imagery and Findings
Images at McCormick & Baxter were taken at a height of 390’ above ground level (AGL) on October 5th, 2024, with research partner Ignacio Lopez-Buson. The flight launch was timed just after the sun set behind the West Hills so that the indirect lighting eliminated all shadows on the site.

Orthomosaic image of McCormick & Baxter (a compilation of hundreds of photos taken during the UAS “drone” flight).
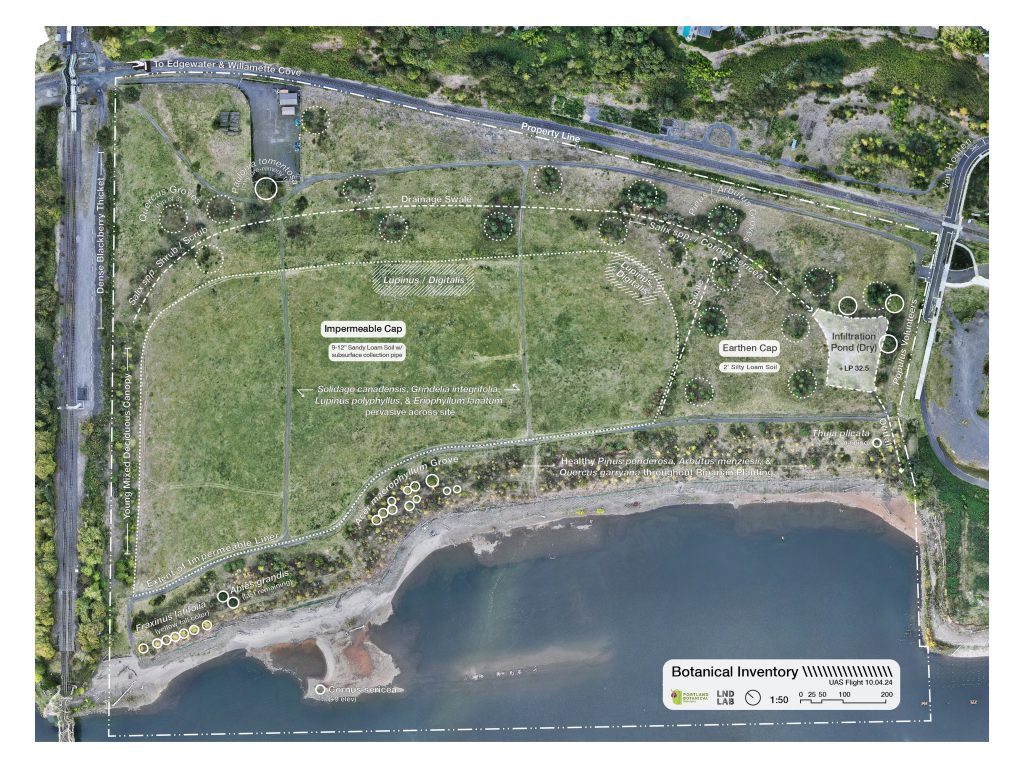
Multispectral imaging is variable based on the season, and this time of year is ideal for studying summer drought stress. Several Vegetation Indices were used to identify areas and species that demonstrated high drought tolerance. Findings were ground-truthed and then represented in a botanical inventory diagram.
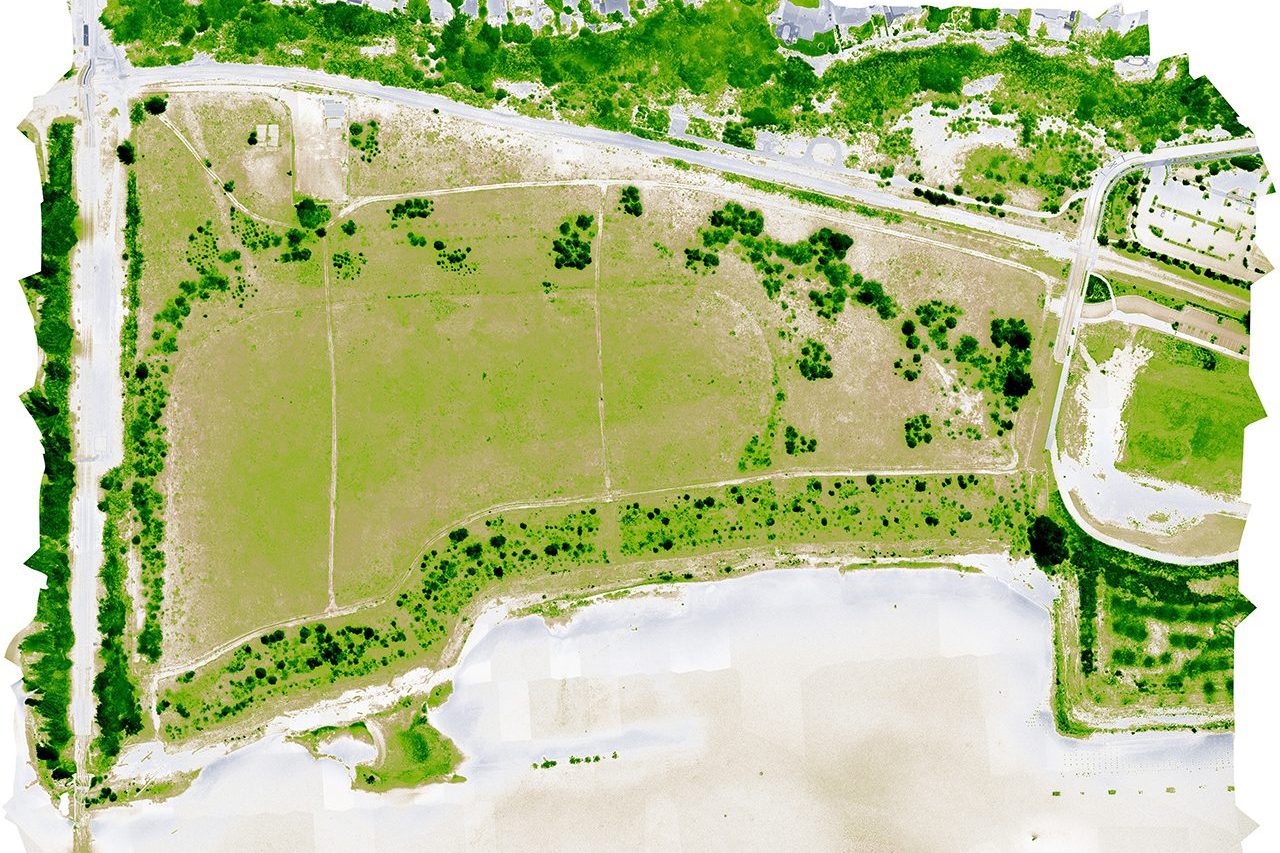
Normalized Differentiated Vegetation Index
NDVI is the most popular metric for quantifying the health and density of vegetation. At McCormick & Baxter, the index best shows which trees on site remain healthy through the summer. These are predominantly Quercus garryana (Oregon White Oak), Arbutus menziesii (Pacific Madrone), and Pinus ponderosa var. willamettensis (Willamette Valley Ponderosa Pine) – all drought tolerant species. The three species were primarily planted in groves along the stormwater swale which runs along the northeast edge of the site, but they were also interspersed in the riparian planting. This is fortuitous. Although they composed just 6% of the original riparian planting, they make up ~90% of the healthy canopy 20 years later. A well-established grove of Acer macrophyllum (Bigleaf Maple) is also present in the riparian area, but most of the other originally planted species had defoliated by October – or no longer exist. Salix spp. (Willow) thickets are thriving in portions of the stormwater swale, but the largest trees in this zone are the volunteer Populus trichocarpa (Black Cottonwood).

False Color Composite
False color images replace RGB information with the defined wavelength bands of multispectral imagery. In this case, near infrared light is shown in red, red light as green, and green light as blue. Because actively photosynthesizing plants reflect near infrared light, they show up as bright red. This image reveals where photosynthesis is still occurring after summer drought – mainly in woody vegetation.

Optimized Soil Adjusted Vegetation Index
OSAVI uses a soil brightness correction factor and is often used in areas with relatively sparse vegetation where soil is visible through the canopy. By omitting this information, vegetation at McCormick & Baxter is represented using a narrower gradient of green. This image mostly helps to differentiate woody and herbaceous vegetation, and in the process, approximates how the site looks when it is most verdant and woody vegetation is fully leafed out.
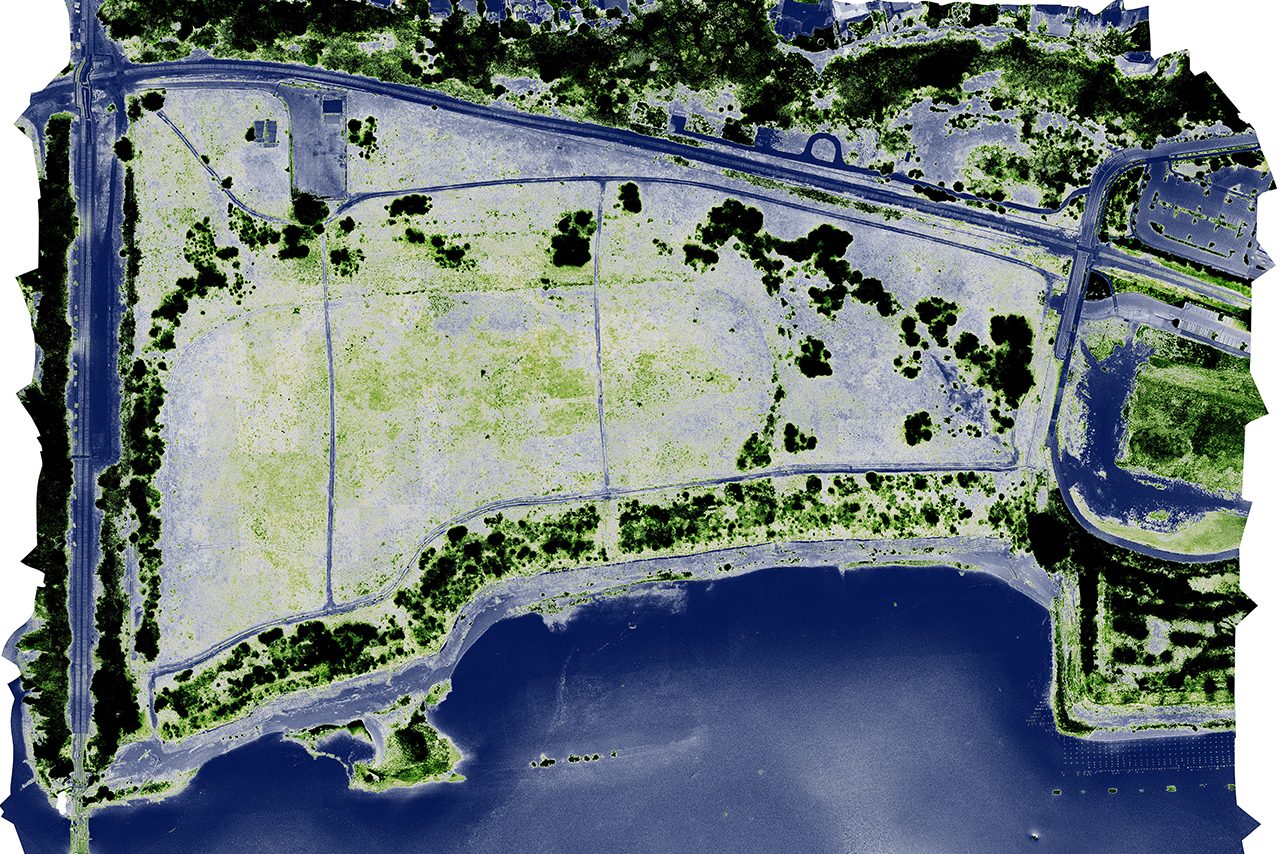
Green Normalized Difference Vegetation Index
GNDVI measures the “greenness” of a plant, or its photosynthetic activity. It’s more sensitive to chlorophyll variation and is used to determine how much water and nitrogen a plant canopy absorbs. This image helps to differentiate the health of herbaceous vegetation. Most herbaceous species were dormant by October, with large areas represented in blue pixels (the same spectral signature as pavement). As a result, the index allows us to identify areas where herbaceous vegetation still contains some chlorophyll, mainly in the center of the site. This information is invisible to the naked eye, but will be very helpful in developing future restoration plans.
Conclusion
The imagery and findings have revealed and confirmed key attributes of the McCormick & Baxter site and its potential as a botanical garden.
- Extreme heat and drought has favored xeric native species – even in the riparian area.
- Outside portions of the stormwater swale, most of the woody vegetation planted in 2005 is under severe drought stress.
- In groundtruthing the imagery, and comparing with the 2005 restoration plan, it was discovered that Alnus rubra, Thuja plicata, Abies grandis, and Rhamnus purshiana experienced near complete mortality in the riparian planting.
- Although a large number of Fraxinus latifolia remain, most had substantially defoliated by early October. Since this species is also threatened by the arrival of the Emerald Ash Borer, the riparian edge of M&B is vulnerable to further deforestation.
- The thin soils and underdrainage system on top of the impermeable cap also compound drought stress, impacting the health of the herbaceous meadow.
- One of the most striking discoveries was the relative health of the meadow in the center of the cap, compared to the absence of photosynthesis where the subsurface collection pipe runs along the edges. This finding will be very helpful for developing future meadow enhancement plans.
- However, because most herbaceous species have gone dormant by October, additional multispectral imaging is necessary in the spring to better understand the species composition and distribution of the meadow.
Together, these observations demonstrate the potential for climate adaptation research at the McCormick & Baxter site. Because of the relatively extreme drought, this “living laboratory” is particularly valuable for researching what may be in store for the Willamette Valley, testing climate adapted plants, and demonstrating xeric gardening practices. In the process, a botanical garden will also mitigate the urban heat island effect in the Portland Harbor – and hopefully the City of Portland by extension.
References
- ESRI An Overview of the Image Analyst Functions: https://pro.arcgis.com/en/pro- app/latest/arcpy/image-analyst/an-overview-of-the-image-analyst-functions.htm
- Vegetation Indices and their Interpretation: https://www.auravant.com/en/articles/precision- agriculture/vegetation-indices-and-their-interpretation-ndvi-gndvi-msavi2-ndre-and-ndwi/
- Overview of Agricultural Indices: https://support.micasense.com/hc/en- us/articles/227837307-Overview-of-Agricultural-Indices